Working with Numbers in OpenRefine
While OpenRefine is a really powerful for cleaning text data - through facets, transformations, and clusters - it can also be used effectively to deal with numbers.
When a table is imported into OpenRefine, all columns are automatically considered to be text. To fix this, we can use transformations (as we did before).
As a reminder, we can transform text values into numbers by...
- Navigating to the dropdown menu for the column;
- Navigating to
Edit cells; - Navigating to
Common transforms; and - Selecting
to number.
Transform the remainder of the number columns that are formatted as text (run_time, ave_rating, num_votes). Once they are formatted to numbers, you should see the values turn green and change from left-justified to right-justified.
Practice
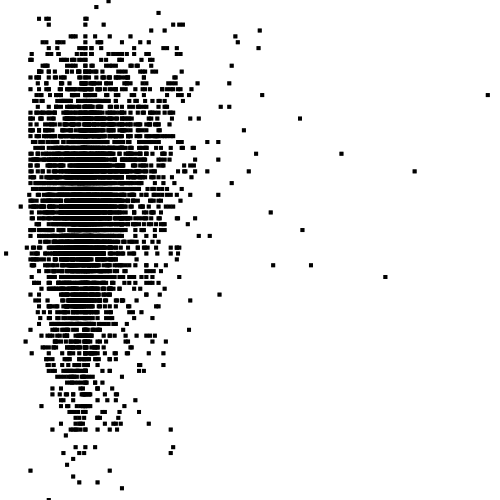
Now that we have multiple numeric columns, we can use a scatterplot facet. Let's use one to look at the relationship between movie rating and movie length.
To do this, navigate to the run_time column, and click on the down arrow to access the drop down menu. From there, select Facet and then Scatterplot facet.... This will open a pop up window with a number of scatterplot option. When you hover over each, you should see a description of the variables appear. Which one should we select?
Solution
You want to select the graph that shows run_time(x) vs ave_rating (y).
What does the scatterplot tell us about the relationship between movie run time and movie rating?